Identifying Network vs. CPU Bottlenecks in Load Flows
Tracing web applications takes time and practice to master. However, there are a few general visual patterns one can use to quickly spot if a web application UX render is slow due to a Network bottleneck or a CPU / Main Thread bottleneck.
Collecting a Trace
Follow this guide to collect a trace of your load scenario. Examples may include:
- A direct browser navigation to your web page
- Navigating to a new page within your SPA
- Opening a Modal or Dialog in your UX
Once it's traced and loaded up in the Profiler, we can then identify how time is being spent.
Use the screenshot view, trace from left to right to find the start and end of your scenario. Adjust your selection in the tool to select the key areas of interest.
CPU Activity
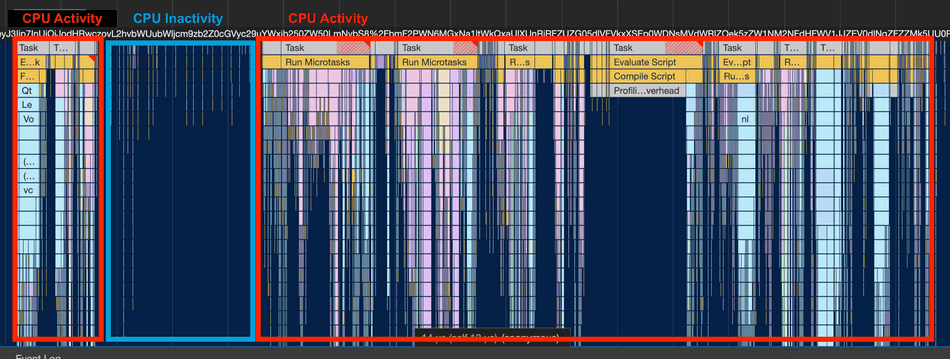
Next, let's examine the CPU activity. If CPU activity (i.e., Tasks, usually JavaScript) are consuming your Main Thread view, then it's likely that CPU is the primary bottleneck in your scenario.
You can spot CPU activity visually by seeing wide, often colorful flamegraphs in the Main Thread pane.

I usually start by observing CPU activity instead of Network activity, because even if there are many Network Requests in progress, they are asynchronous, they don't directly degrade Main Thread activity. Put another way, a busy Main Thread usually indicates a CPU related bottleneck, even if there in-flight network requests.
CPU Inactivity often indicates Network Dependency
If your scenario in the profiler presents large gaps between tasks (i.e. periods of Main Thread of inactivity), this usually means you have network dependencies that are loading, and the Main Thread is not being given much work to perform.
This may mean you have the sequential network request anti-pattern in your critical load path.
Locating the Network Dependency
Typically, once a required network dependency is loaded, modern web applications kick off additional client-side rendering tasks (like React Effects triggering re-rendering). We can use this behavior to help us spot what network dependency is the bottleneck.
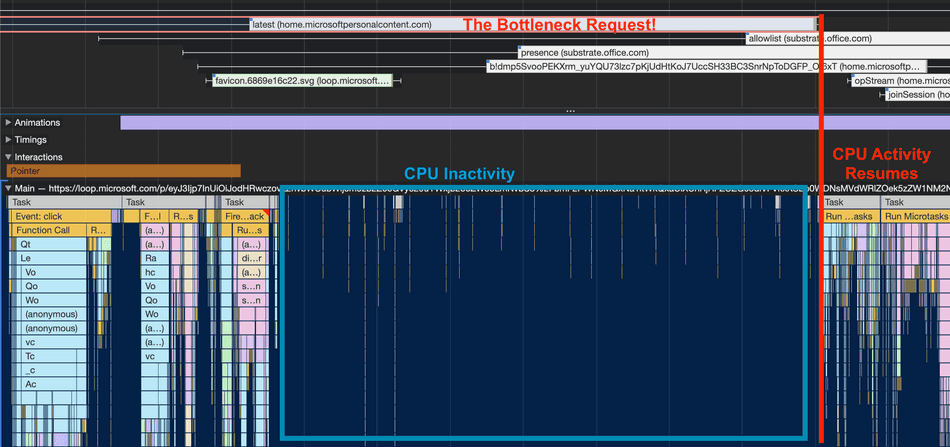
Locate the timestamp at the start of where CPU activity resumes.
Look up along that timestamp and find Network Requests in the Network Pane that terminates near that timestamp. These are your likely network bottlenecks!

In the above screenshot, the request home.microsoftpersonalcontent.com/latest is taking several hundred milliseconds
of time to complete after the click event before the CPU can resume activity and is therefore contributing to a performance bottleneck!
Recap
Strategies for optimizing a web application's CPU execution vs. Network dependency time will vary. Make sure to measure and use the profiler to help you understand what's contributing to bottlenecks in your application's critical scenarios!
These visual patterns are not exhaustive but are common enough you can use this as a starting point to guide your investigations!
That's all for this tip! Thanks for reading! Discover more similar tips matching CPU, Network, and Profiler.

