Detecting when the Browser Paints Frames in JavaScript
Do your performance measurements capture when the browser renders pixels to your user?
Most likely, not! In my experience, most developers capture Render Time metrics at some arbitrary time when React or other JS code is constructing DOM.
It's not surprising, as the browser doesn't provide an API to notify developers that a Paint event occurred, other than for the initial Frame paints on page load.
In this tip, we'll cover how to measure when pixels appear on the screen at any point in your application's lifecycle, and how it works under the hood.
Prerequisites
- You should understand the browser event loop
- You should also be familiar with performance timing markers
Why capture Paint time?
Capturing Paint time measures one of the most important scenarios for your users -- the UI is presented on their screen!
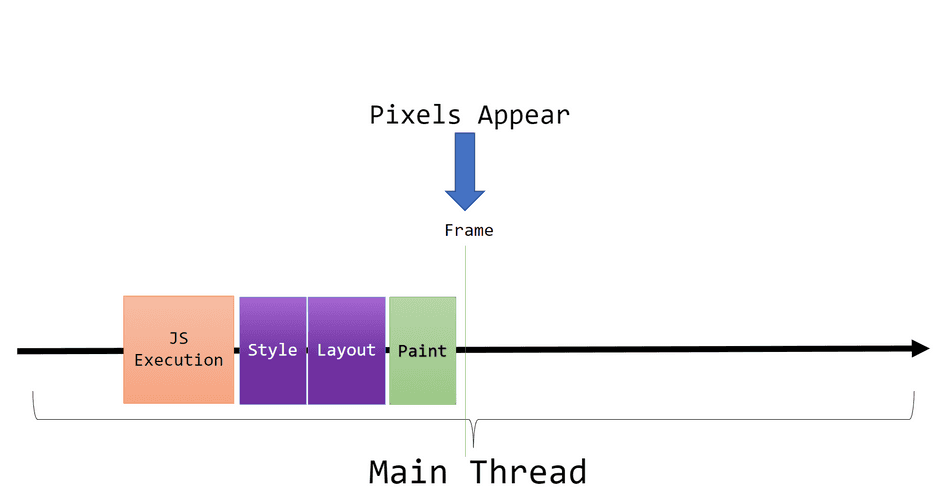
It can also help highlight any additional time or inefficiencies between your DOM updates and when the Frame is produced.

Inefficiencies between DOM update Tasks and Frames may include:
- Long Render Steps time - you may have due a complex UIs with many elements and expensive visual properties
- Long JS Tasks - your JS DOM update Tasks are slow and prevent the browser from producing a Frame
- Competing Tasks - the browser's Task Queue is flooded with Tasks, and runs other tasks between your Task and producing a Frame
When does Paint occur?
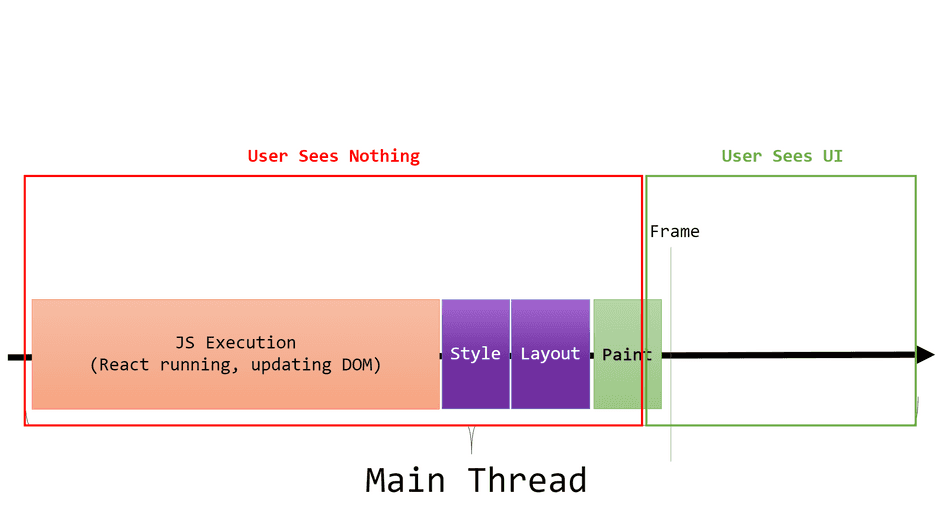
The browser event loop is responsible for interleaving your JavaScript tasks (like React DOM updates) and rendering Frames on the browser's Main Thread.
This means that any DOM updates in your JavaScript must complete before the browser can present those updates visually to your users.
For example, let's say you have some React rendering that drives the presentation of your UI to your users. Any changes made by React via JavaScript won't be visually reflected until after Paint runs.
Detecting when Paint occurs
The most flexible and cross-browser compatible way to detect when Frame paint occurs is through the following snippet:
/**
 * Runs `callback` shortly after the next browser Frame is produced.
 */
function runAfterFramePaint(callback) {
    // Queue a "before Render Steps" callback via requestAnimationFrame.
    requestAnimationFrame(() => {
        const messageChannel = new MessageChannel();

        // Setup the callback to run in a Task
        messageChannel.port1.onmessage = callback;

        // Queue the Task on the Task Queue
        messageChannel.port2.postMessage(undefined);
    });
}
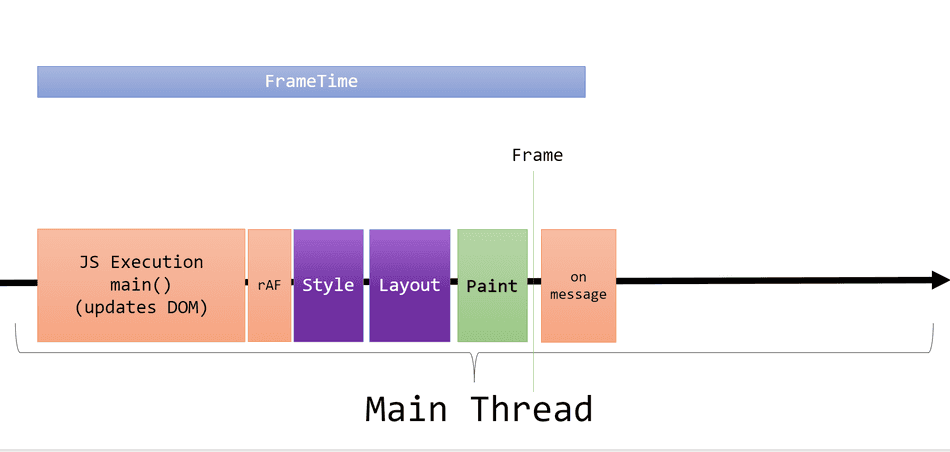
You will want to invoke runAfterFramePaint in the same Task as the one that's performing your DOM updates.
For example:
function updateDom() {
    const node = document.getElementById('some-node');

    node.innerText = 'Some Text';

    // Other DOM Updates...
}

function main() {
    performance.mark('App_Start');

    // Updates DOM in this Task
    updateDom();

    // Queues a requestAnimationFrame relative to this executing Task
    runAfterFramePaint(() => {
        performance.mark('App_FrameProduced');

        const measure = performance.measure('FrameTime', 'App_Start', 'App_FrameProduced');

        console.log(`The Frame was produced after ${measure.duration}ms`);
    });
}

main();
If we visualized this snippet on the Main Thread, it would look like this:
Note:
requestAnimationFrameis often abbreviated as rAF and verbally pronounced as "raff".
How does this work?
At first glance, the APIs invoked here look quite peculiar given our objective is to measure Frame time:
- We aren't animating anything -- why are we calling
requestAnimationFrame!? - We aren't messaging anything -- why are we posting to a new
MessageChannel!?
However, understanding how the browser represents these two APIs will clear things up!
requestAnimationFrame
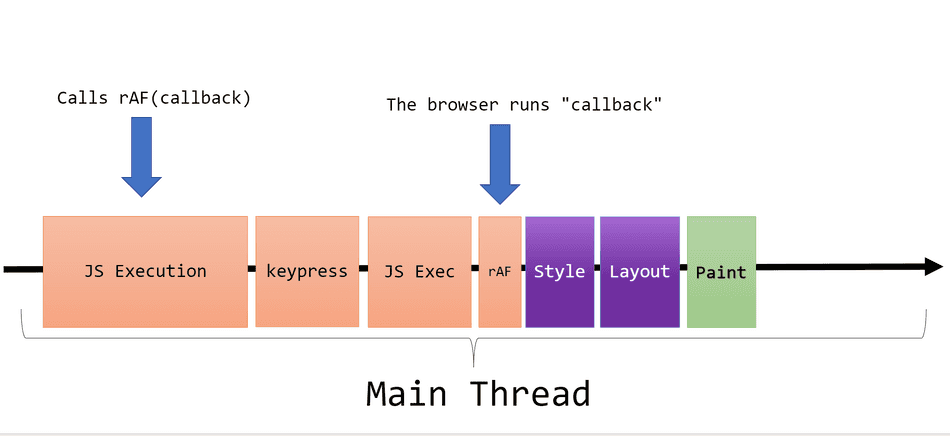
requestAnimationFrame allows web developers to run a callback right before the browser completes next the Render Steps Task.
This differs from ordinary Tasks, which are interleaved by the Event Loop and drawn from the Task Queue.
Observe the following diagram, and when requestAnimationFrame callbacks run:
For more details on
requestAnimationFrame, read my in-depth tip on the API.
MessageChannel
MessageChannel is usually used for posting messages between threads or processes within the browser, but we aren't utilizing
it for its intended purpose here!
I've extracted the relevant part of runAfterFramePaint here for reference:
const messageChannel = new MessageChannel();

// Setup the callback to run in a Task
messageChannel.port1.onmessage = callback;

// Queue the Task on the Task Queue
messageChannel.port2.postMessage(undefined);
MessageChannel is being used here as a generic mechanism to Post a Task to the Task Queue.
Furthermore, Tasks posted to the Task Queue via MessageChannel are prioritized above most
other Tasks.
As a result, what we are telling the browser to do here is: Run callback as a Task, with high priority.
Putting it together
When we call postMessage inside of requestAnimationFrame, the the browser is instructed to queue a high priority task
on the Task Queue.
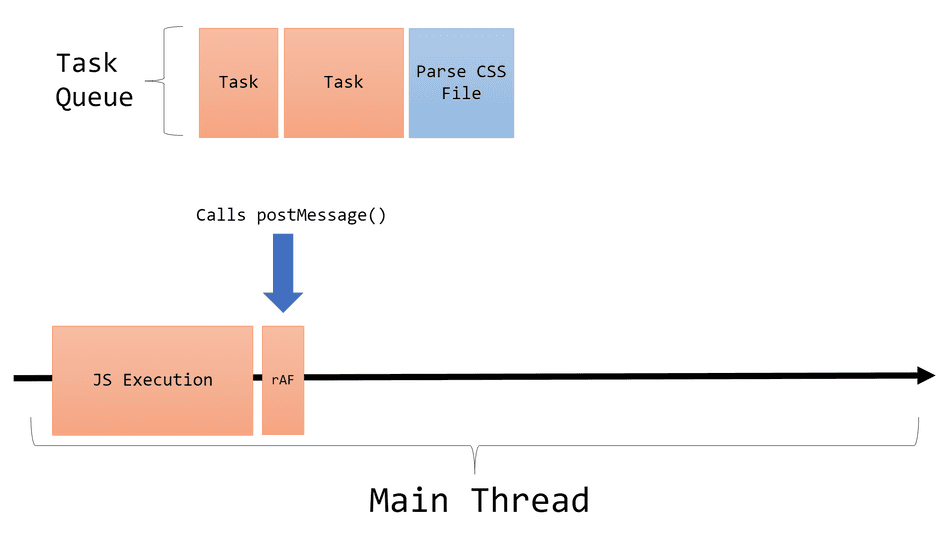
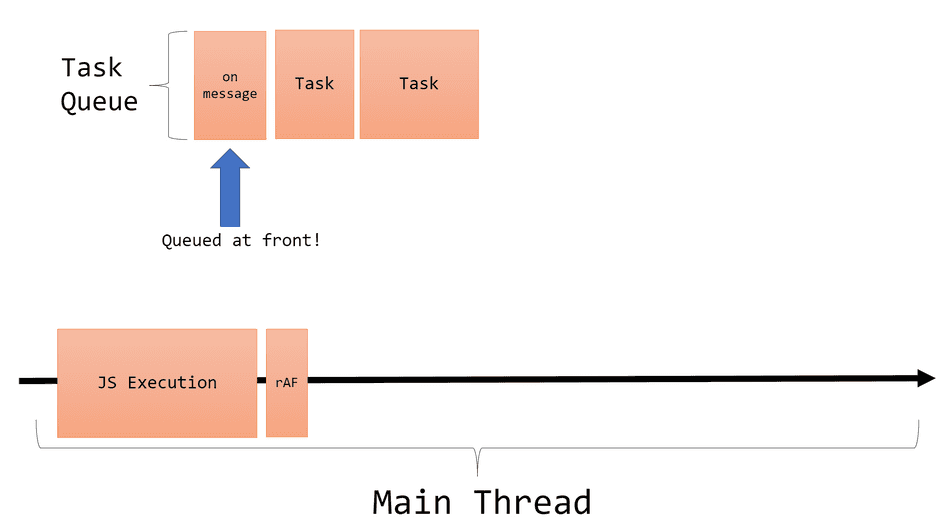
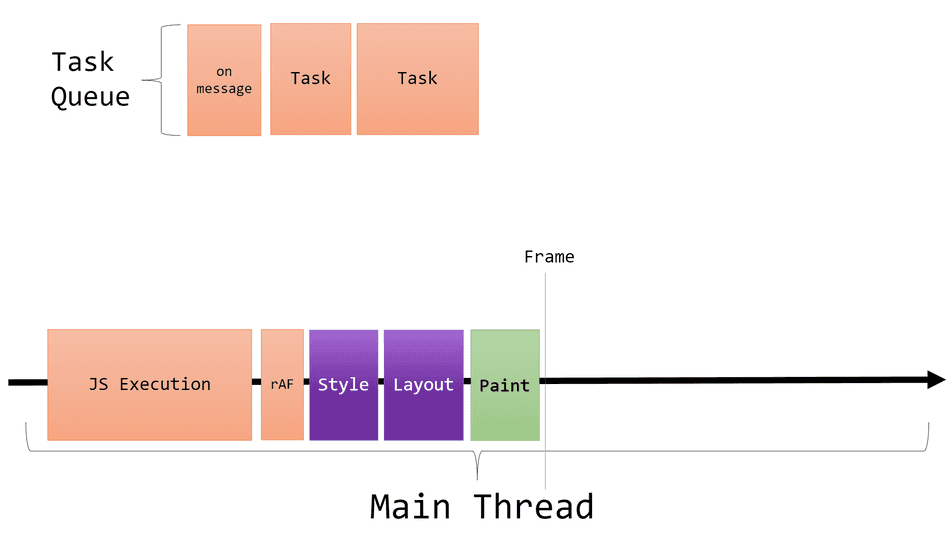
Once the Task is queued, the browser continues to produce a Frame by completing the Render Steps (which always run after requestAnimationFrame
callbacks complete).
Once the Render Steps complete, the Event Loop resumes pulling from the Task Queue, and selects the next Task -- in this case, a high-priority
onmessage Task.
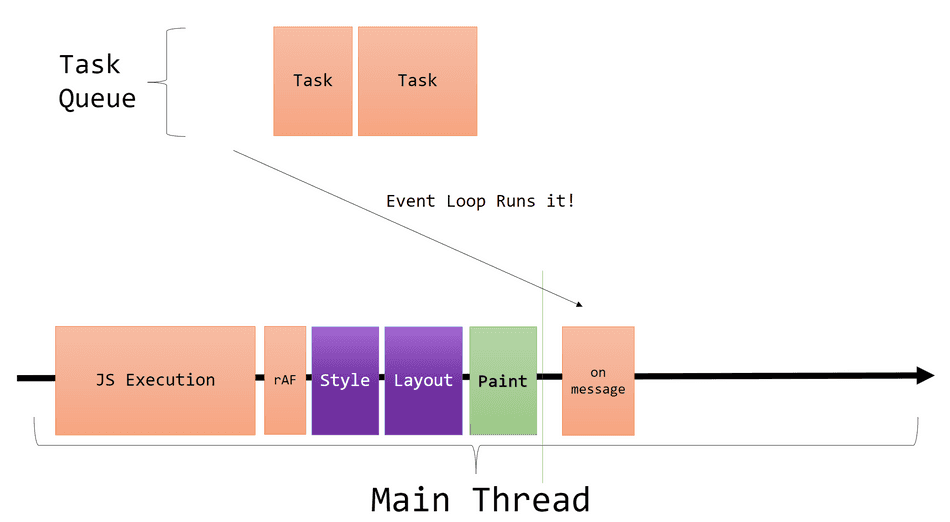
We now have a handle into a Task that runs shortly after Frame paint!
How accurate is this?
This method is not 100% accurate, but it's as close as web developers can get with currently available browser APIs.
A few points of note:
requestAnimationFramewon't run if the page is hidden (i.e. in a background tab), so you should exclude hidden tabs from your measurements.MessageChannelonmessagecallbacks are high priority, but input events likeclickandkeypresstake precedence, and so it won't always run immediately after a Frame is produced.
Example App
I've put together the example above in a demo page for you to collect a trace of yourself!
In this example, I capture two measurements:
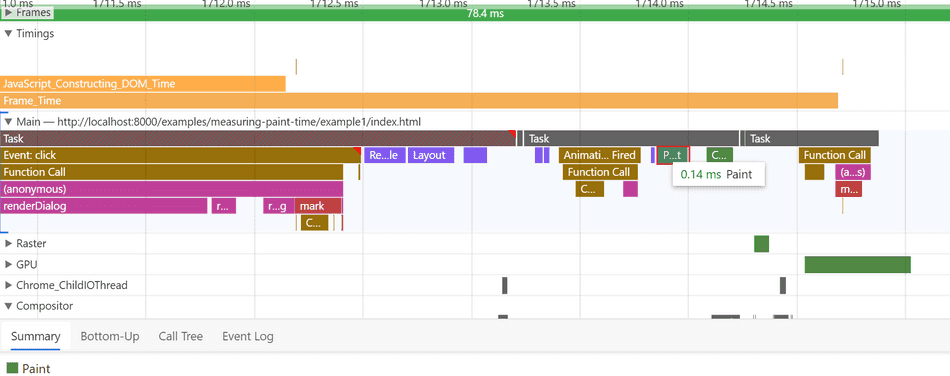
JavaScript_Constructing_DOM_Time- represents the time from click to completing all DOM editsFrame_Time- represents the time from click to presenting the DOM edits to the user's screen as a Frame
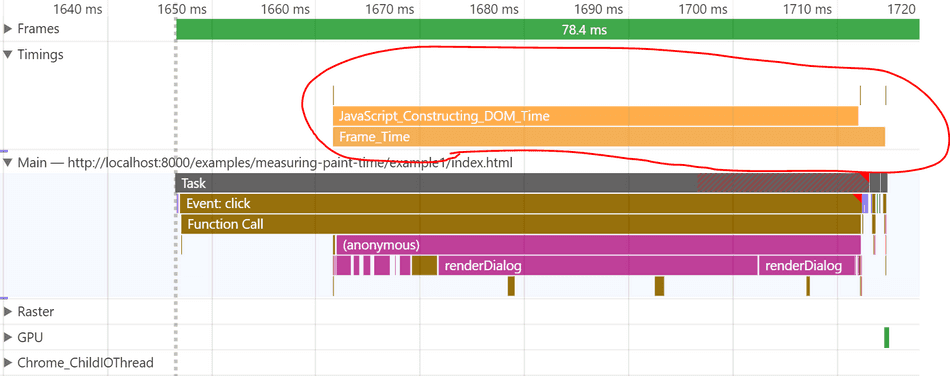
One can observe that the Frame_Time is longer than the JavaScript_Constructing_DOM_Time, because it includes the Render Steps Tasks:
Conclusion
With this knowledge you can ensure your performance marks and measures are user-centric, and capture when your key pixels are visualized on your user's screen.
Consider the following tips next:
- Capturing Frame paint time in a React app
- The browser rendering pipeline
- requestAnimationFrame in depth
- Browser scheduling internals
That's all for this tip! Thanks for reading! Discover more similar tips matching Browser Internals and Measuring.

