Function Self Time
In this tip, we'll discuss function self time, how it's represented in a flamegraph, and how it differs from cumulative time.
Understanding self time will help you identify inefficient codepaths in your web application.
Prerequisites
- You should know the fundamentals of basic flamegraphs.
- You should understand flamegraph shapes and advanced topics.
An Example
Self time is how long a function takes to execute within its own stack frame, exclusive of other functions it calls.
Let's consider this example:
function b() {
    const start = Date.now();

    // Do something for 50ms
    while (Date.now() - start < 50) {
        /* Block the Thread */
    }
}

function a() {
    b();

    const start = Date.now();

    // Do something for 100ms
    while (Date.now() - start < 100) {
        /* Block the Thread */
    }
}

a();
Notice the following:
function a()callsfunction b()function b()runs for 50msfunction a()runs 100ms of work afterfunction b()is done running.
Flamegraph
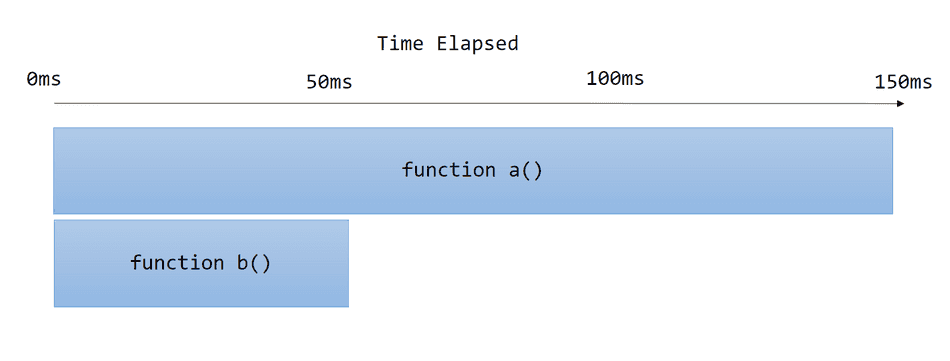
If we represented this example as a flamegraph, it would look like this:

Cumulative Time
Cumulative time is the amount of time a function spends executing, inclusive of downstream function calls in may invoke.
In this example above:
function a()has a cumulative time of 150ms, because it runs 50ms ofb()and then 100ms withina()function b()has a cumulative time of 50ms, because it runs for 50ms and calls no other functions.
Self Time
Self time is the amount of time a stack frame takes to execute, exclusive of downstream function calls it may invoke.
To be clear, in this example:
function a()has a self time of 100ms, because it runs 100ms worth of work within its stack frame, excluding downstream function calls.function b()has a self time of 50ms, because it runs 50ms worth of work within its stack frame.
Notice that b() has the same value for both its self time and its cumulative time, because it's the last call in the stack frame.
Identifying Self Time in a Flamegraph
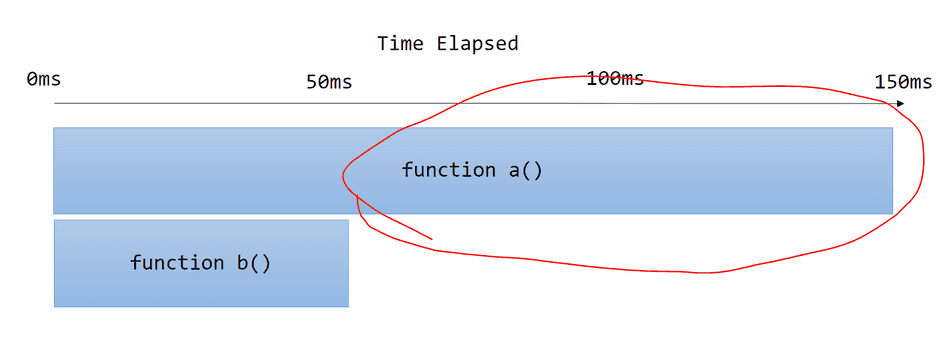
Functions with long self times indicate synchronous and inefficient work; they manifest as wide bands in a flamegraph with no tips or spikes below.
Here I've circled the self time for a():

Once you find a region with a large self time, you can scope to the codepath to see what it's doing!
In the Profiler
I've created an example page for our example above, and collected a trace of it running.
The profiler produces a flamegraph that looks like this:

Note that due to the way the Chromium Profiler collects data, we don't get a perfectly exact and neat band for each stack frame.
However, we can still inspect self time for each sample the profiler has collected!
On Hover
When you hover over a band in the profiler, it will denote both cumulative and self time:

Notice here that the band that was collected for a() has 52.07ms recorded as cumulative time, but 4.32 ms of self time (captured at the end).
If I hover over a band of b running, I see the the following:

Here, of the 31.84ms execution of b that was captured as cumulative time, 27.83ms of that time was b's self time, while the difference
of about 4ms went to some code optimization and garbage collection internal to the browser.
Bottom Up View
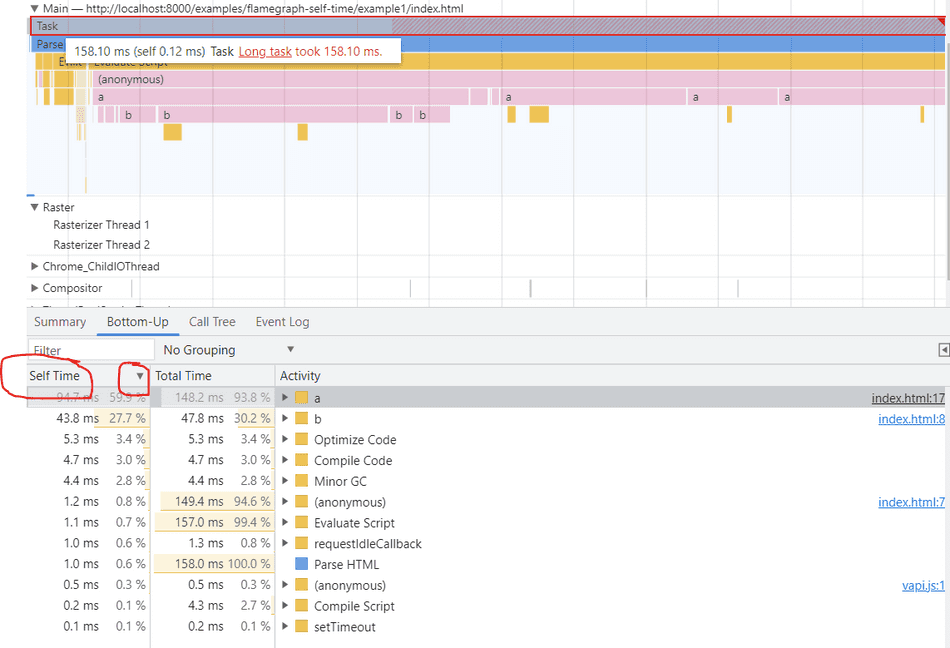
If you want to see which functions have the largest self time (i.e. the slowest code paths) within a Task, you can select the Task or any other flamegraph band of interest, and pull up the Bottom Up tab, and sort by self time:

In this view, we can see:
ahas the longest self time of 94.7msbhas the second longest self time of 43.8ms- The remaining work within this task has a small amount of self time (< 5ms)
This would indicate that a and b are the heavy functions in this task, and should be investigated further for optimization.
Conclusion
Using self time can help guide you to identify slow and inefficient codepaths within a flamegraph.
Once you've found the codepath of interest, you can scope to it to see what it's doing and apply an optimization!
That's all for this tip! Thanks for reading! Discover more similar tips matching CPU and Flamegraphs.

