Identifying the source of slow codepaths in the Chromium Profiler
The Chromium Profiler produces incredibly useful visualizations via flamegraphs to help us understand what is consuming CPU time in thread tasks.
In this tip, we'll walk through how to map back to a codepath in your web application once you've found a region of interest in the profile.
Prerequisites
- You should have a trace collected of your web application.
- You should understand how to read flamegraphs.
Step 1: Identify a Region in the Flamegraph
In your profiler UI, you should have a trace loaded of your web application.
For example, I've loaded up a trace that looks like this:
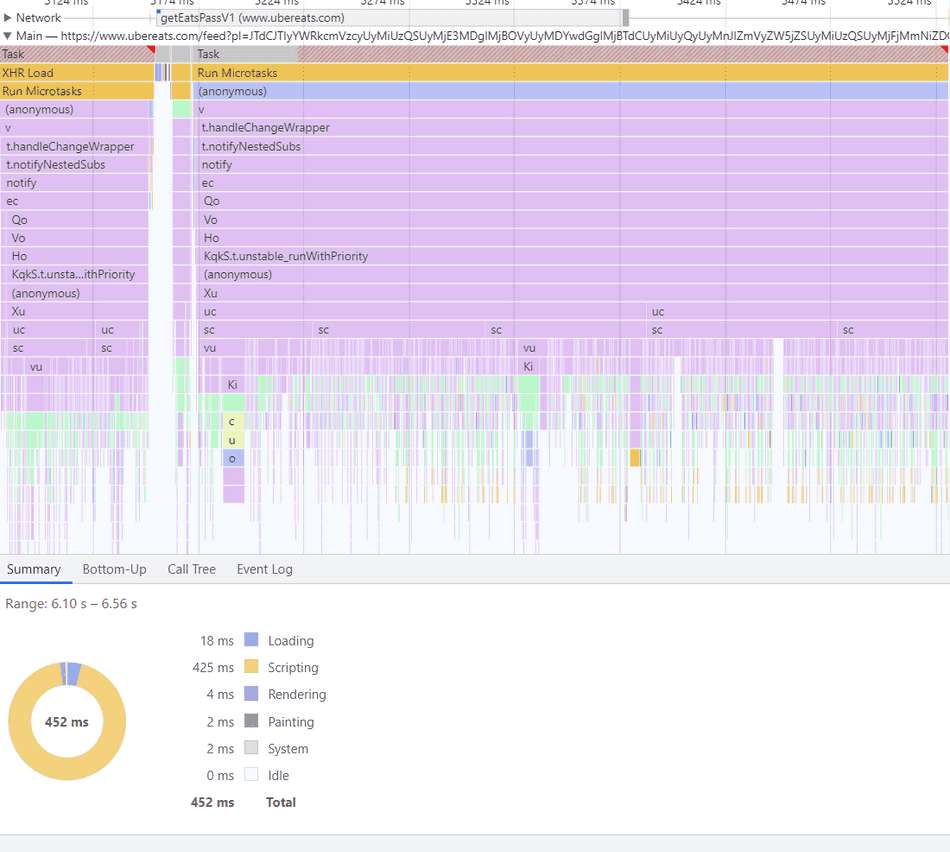
Using my knowledge of flamegraph shapes, I notice that there's a high-frequency codepath being executed here:
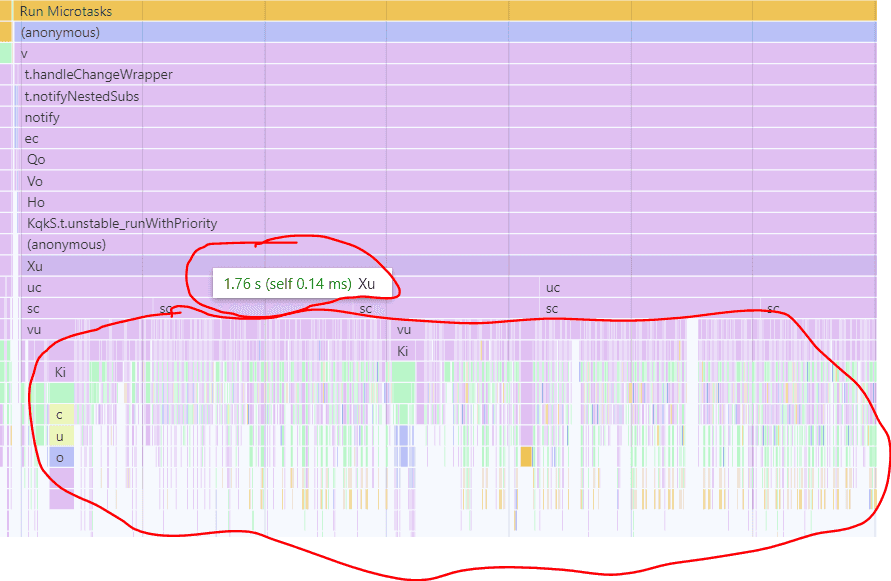
I am interested in what this high-frequency operation is in my application's code, so I can apply an optimization and reduce overall task time.
Step 2: Zooming to Region
Adjust your profiler selection to your region of interest.
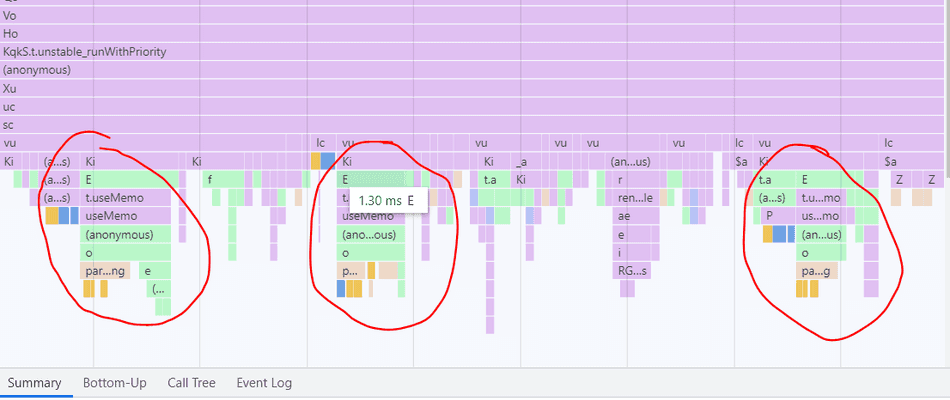
In my case, I'm interested in one of those narrow spikes, so I'll go ahead and zoom into that:
Step 3: Selecting a Band
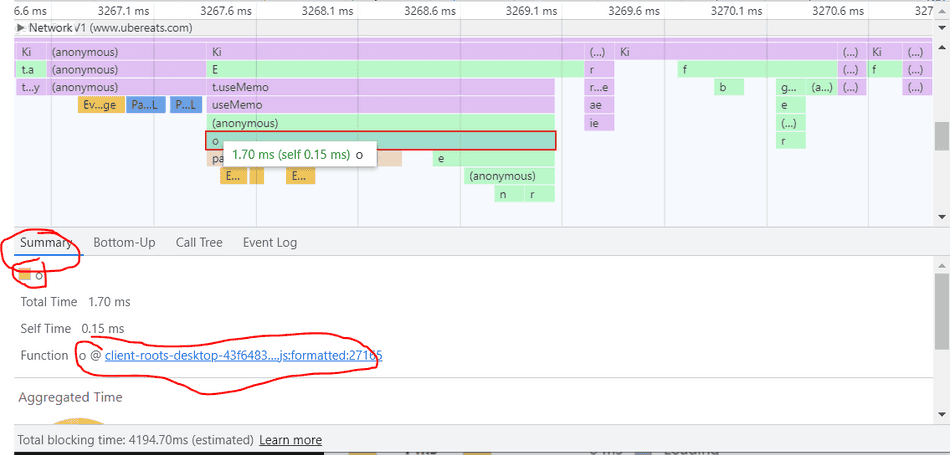
In the flamegraph of the spike, we see the o function at the tip of the spike, so that is where I'd likely start
my investigation.
Production web apps utilize minification to reduce their payload size, so it's unlikely to see useful names in the profiler bands when tracing one.
In my case, I'd click the band of the o function, and reveal the script details in the Summary pane.
Step 4: Select the Script
At the bottom, you'll see a blue link to the name of the script. Clicking this link will take you to the code file containing this function.
For example, if I click the clients-root-desktop-43f...js:27165, it will take me to that code file in the Sources pane.
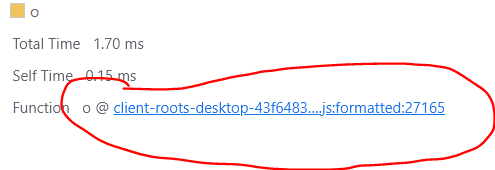
Note: If you did not collect this profile yourself (i.e. it's been imported), then this won't work, but unfortunately, Chromium won't denote this when you try and click.
Step 5: Beautify in Sources
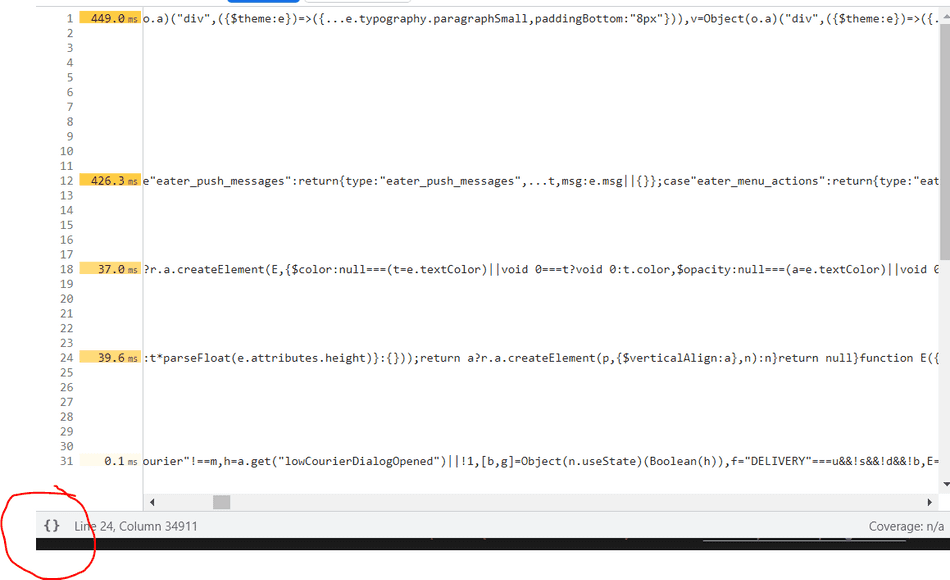
Once you have clicked your codepath, you'll get see the Sources pane open with a minified script.
In the bottom left, there's a very tiny button that will format this code nicely for you to inspect.
Step 6: Observe Codepath
The codepath should be nicely formatted and you can inspect it:
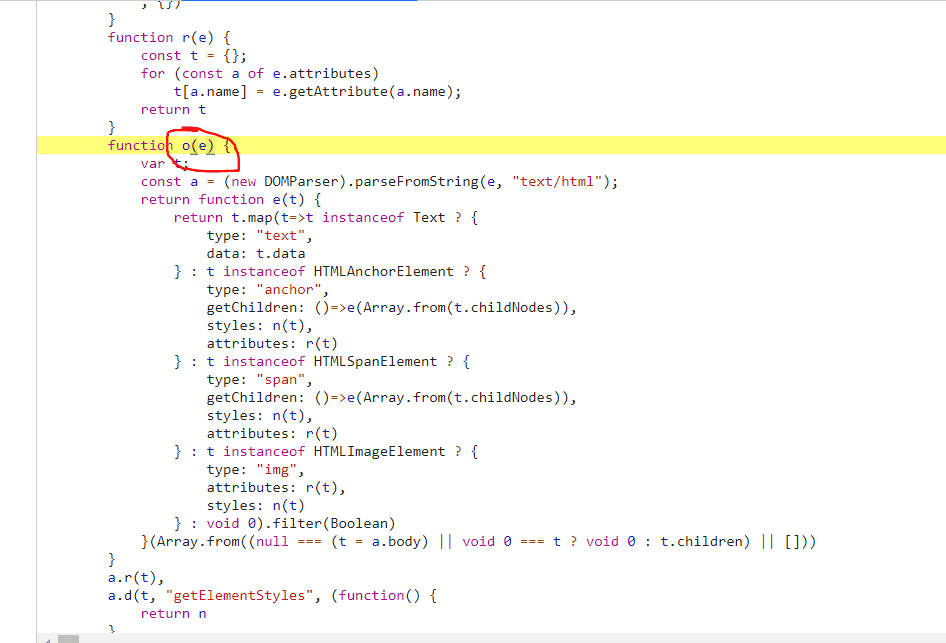
Now we can see what our o function is actually doing!
If you or your team own the web application that you are profiling, the beautified-minified code should look familiar enough to map back to something in your codebase. If not, it could be a bundled dependency, so you may need to debug through the callstack to see how and when this code gets executed.
Step 7: Identify Inefficiencies
DOMParser.parseFromString
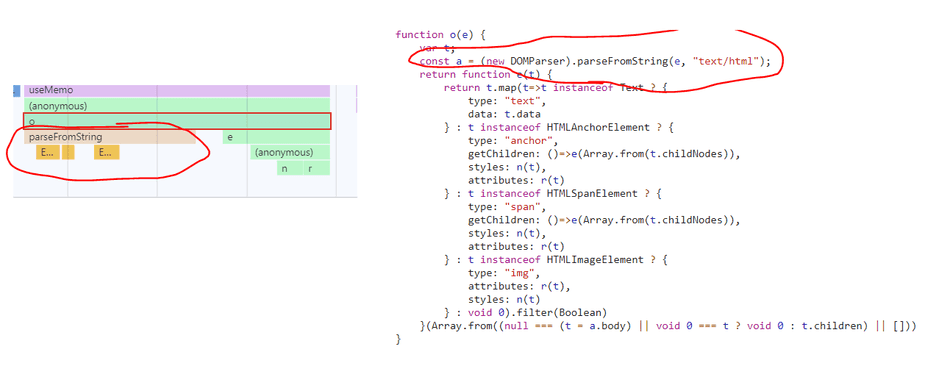
In this specific example, I see that o is being executed in high frequency. In addition, I can see that the o
function is creating a new DOMParser object, and invoking parseFromString, which is a browser API, and often
slow if run in high frequency:
Loops and String Operations
I also see here that o invokes e, which invokes a lambda (the (anonymous) function), which invokes r and n:

Inspecting r and n, I see each of them is doing synchronous work, notably for loops and reduce with string trimming respectively.
I scope to these function the same way I scoped to the o function in Step 4, except selecting r or n in the flamegraph.

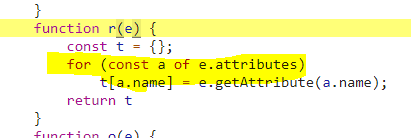
Both of these operations are synchronous, and although they are not heavy in isolation, the frequency at which they are run contributes to an overall bottleneck in this Task.
Conclusion
By utilizing flamegraphs and the technique we've outlined in this tip for code scoping, you can quickly identify which blocks of code are contributing to your CPU time on your thread.
Once you've identified a block of code in the Sources tab, you can map this back to your source code and apply an optimization!
Consider these tips:
That's all for this tip! Thanks for reading! Discover more similar tips matching Beginner and CPU.

