How to Read the Chromium Profiler Network Pane
Network bottlenecks are one of the most common types of performance issues in web apps I diagnose.
The web fundamentally operates by retrieving remote resources and loading them into the client browser to drive our web applications. Therefore, it's important our web apps load network resources in the most optimal way!
The Chromium Profiler gives us insight into how and when network resources are loading.
Prerequisite
You will need to collect a trace and load it into the Chromium Profiler.
Network Pane
With your profile loaded up, the first pane you will see is the Network pane:
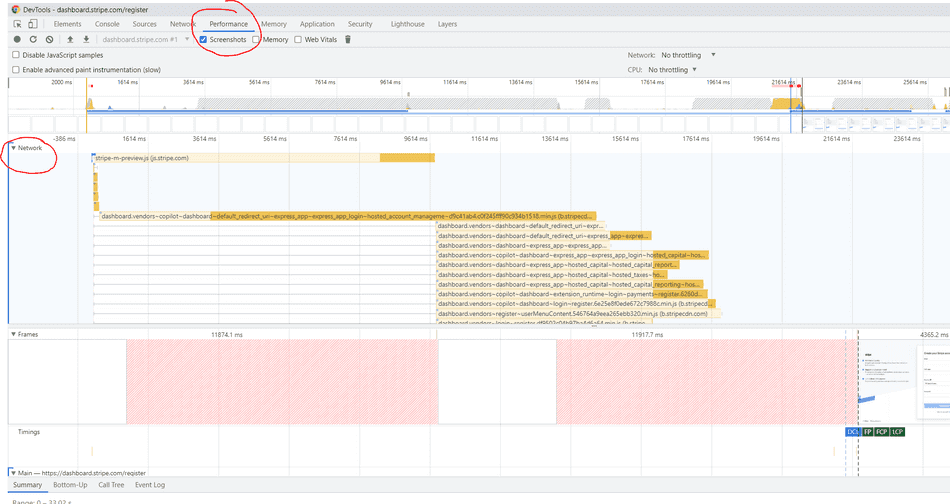
Note: This is different from the Chromium Network Tab, which is used to view, debug, and replay Network Requests (similar to Fiddler).
While both the Profiler Network Pane and the Network Tab can be used together to investigate network bottlenecks I'll only be discussing the Profiler Network Pane in this tip.
Understanding the UI
Colors
The Chromium F12 Profiler color-codes various network resources types.
Scripts
JavaScript resources get colorized as this orange / yellow color:

CSS Styles
CSS resources get colorized as this purple color:

HTML Documents
HTML Documents, including IFrames, get colorized as this blue color:

Image resources
Images, gifs, etc. get colorized as this green color:

JSON Data, Binary, and other resources
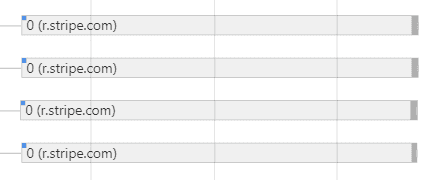
JSON API data, Binary resources, and all other resources are colorized as grey:
Shape
When you look at requests in the Network Pane, each request has a standard shape:
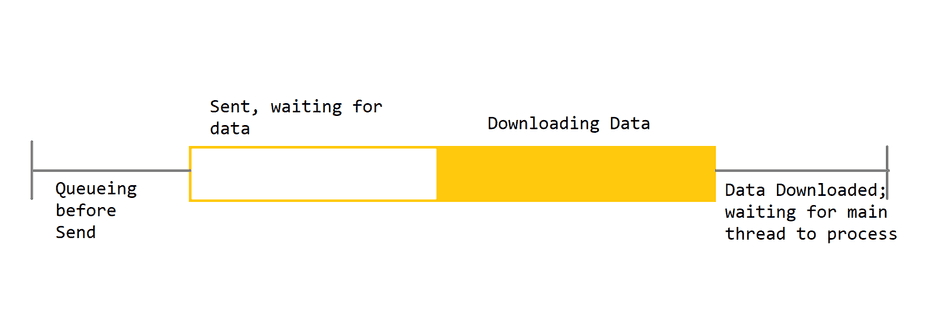
Queueing Before Send
Requesting data doesn't always translate to the request being sent immediately. The browser utilizes a standalone Network process, which has its own Event Loop that can get clogged up.
The Browser Network Process can also defer some requests via internal notions of prioritization, denoted when you hover over a request.
In this request below, the Network process prioritizes the file as Highest priority, so it has almost no queueing time.
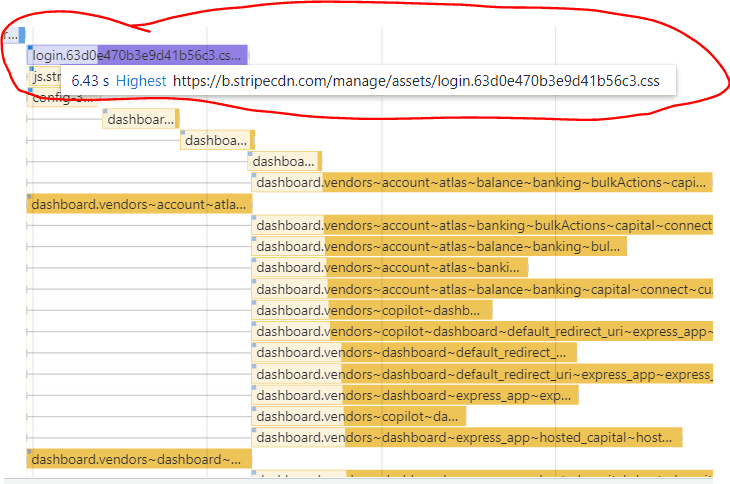
This contrasts with the request entries directly below, which are marked as Low priority, which have more queueing time, despite being requested by at the same time:
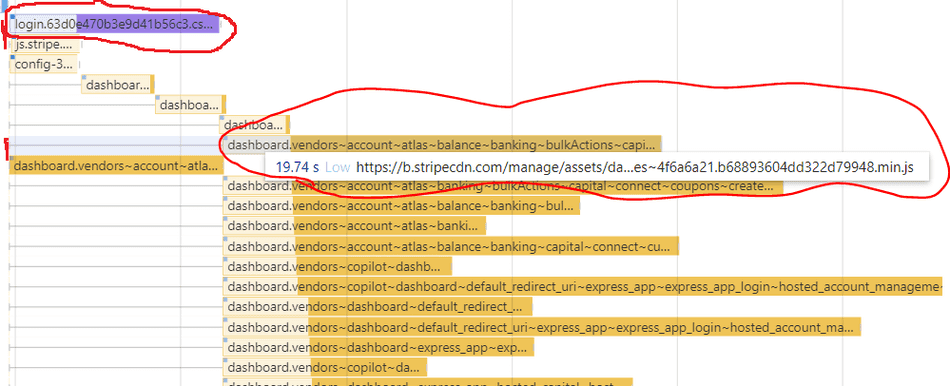
In addition, if using HTTP/1.1, only 6 parallel connections can be made at a time. If you exceed that limit, you will likely see extended queueing time for some of your connections.
Sent, waiting for data
This phase of the network request indicates the time the browser is waiting for a response.

In my experience, if this is particularly long, it's due to two common issues:
- Slow or unreliable user network speed when trying to establish a connection to the target endpoint.
- Slow backend, indicating that the target backend is taking a long time to process the request, before sending any data back.
Downloading Data
The most well-known phase, the downloading phase of the network request indicates the time taken to receive all bytes of the resource from the remote endpoint.

The most common bottlenecks here are due to:
- Large payload size
- Slow or unreliable user network speed while downloading the resource
Downloaded, waiting for Main Thread
Just because a resource is downloaded doesn't mean it's been received by the process running your web application.
If a resource was able to download successfully, but the main thread of the web app process is too busy to receive it, you will see wait time for the resource to load:

The end of the wait time is associated with a Finished Loading or Receive Data event on your web app process' main thread.
The most common bottleneck here is due to CPU contention on your web app's main thread; your app is likely too busy running JavaScript or other tasks, so much so it can't process the downloaded data.
Non-blocking behavior
When engineers look at the Profiler and see the Network Pane, it's often the assumption that these network requests in the network pane are "blocking" the app from running.
Although web apps run JavaScript and most other tasks on a single thread, the design of the browser ensures asynchronous tasks are non-blocking.
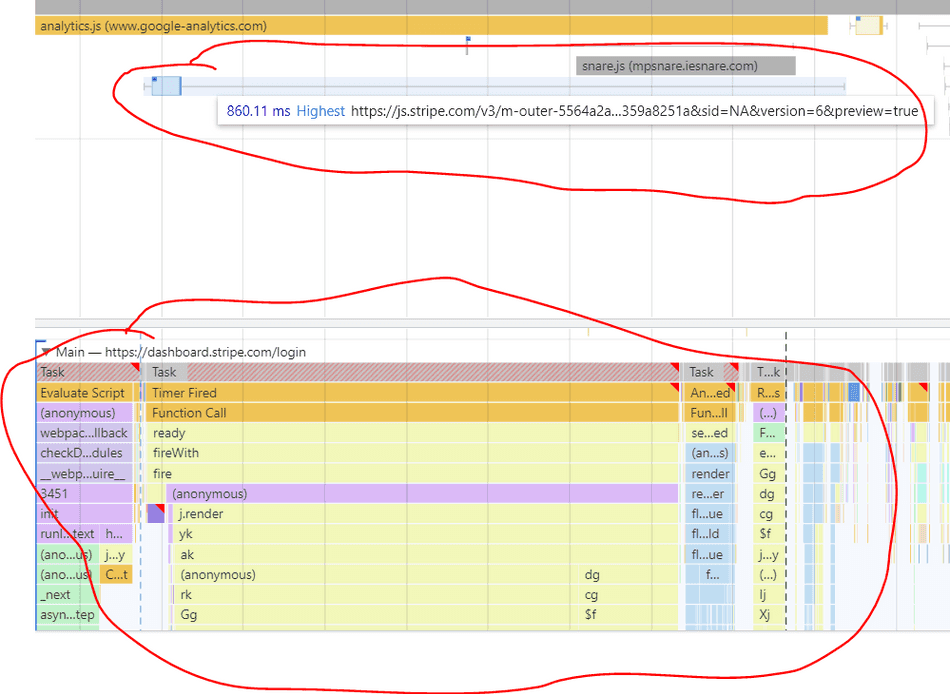
Network requests are classified as asynchronous, therefore requests in-flight do not pause the UI thread and the UI thread can continue responding to user inputs and executing JavaScript.
In this example, you can see JavaScript executing while a network request is in-flight:
Selecting a request
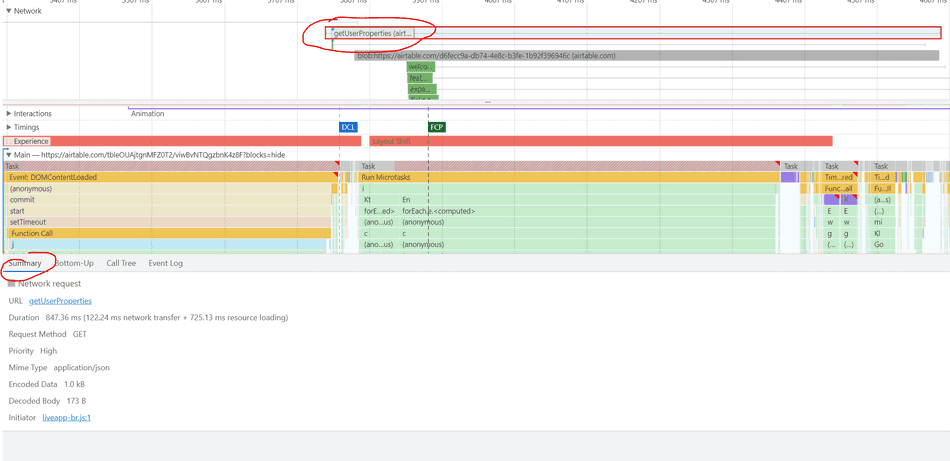
You can see more information about a request by selecting it and viewing it's summary in the Summary Pane:
Conclusion
You know can read and understand the Profiler Network Pane!
In future tips, I'll cover common network bottlenecks in depth, and how you can spot them!
Consider:
That's all for this tip! Thanks for reading! Discover more similar tips matching Beginner, Network, and Profiler.

